Supply chain & logistics
Orders about to slip, stock sitting too long, suppliers and carriers that run late, and what transport really costs.
Connect → Understand → Verify → Steer → Ask → Act
Flip the card: here is the answer
Every question is tied to the report that answers it.
The reports setup proposes
One for each goal you pick, plus Data health. Open the tabs.
Supply Chain 360 — Track what arrives on time, and what does not
Over time
shape only
- What it answers
- Late deliveries are what customers actually remember.
- What it reads
- Your orders with the date promised and the date delivered.
- Example finding
- One carrier accounts for most of the recent late deliveries.
Shapes and findings are examples. Each report is built only when your data holds what it reads; one that cannot be built is named at setup, never estimated.
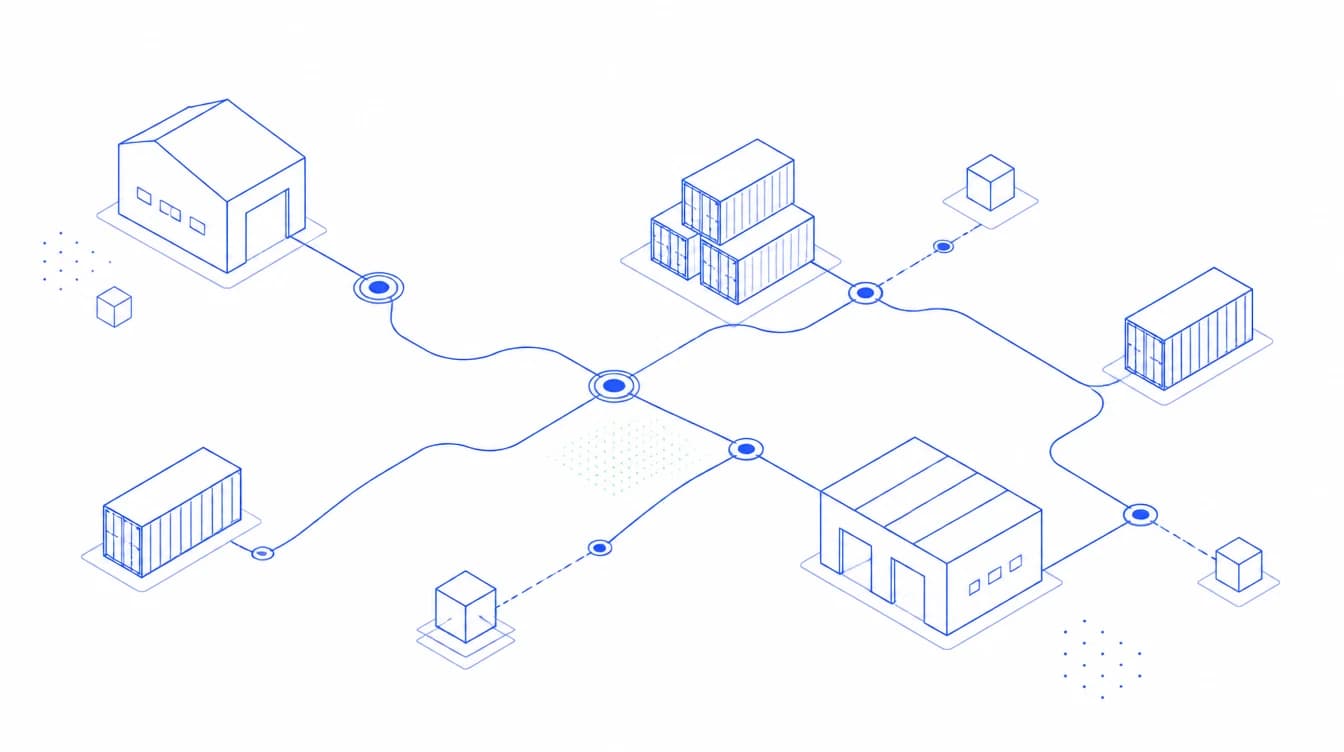
Everything converges into a single model
From Snowflake, Amazon S3, PostgreSQL, MySQL, Odoo, Salesforce or a file from your computer. What is missing gets flagged, not guessed.
- Your orders with the date promised and the date delivered.
- Your stock levels by item and site, followed over time.
- Your purchase orders with the date promised and the date received.
- Your shipments with their cost, weight and destination.
- Your open orders with quantities, due dates and stock on hand.
None of this is required. Each report reads only its own line; one whose data is missing is named at setup, never guessed.
What Data360 finds in your data
Every issue is translated into a business consequence.
Checks running
5 checks- The same order recorded twice
- Products not linked to a site
- Deliveries with no arrival date
- Stock counts that arrive late
- Two different promised dates for one order
Rows that pass each check
Measured on the same data your reports read.
Percent of rows, illustrative. Real scores are measured on your own data.
Business findings, not technical alerts
Each finding names the report it comes from.
Twelve orders are likely to miss the date promised to the customer.
From the report Spot the orders about to slip
Most of the slow stock sits in a handful of products.
From the report See where stock is sitting too long
One supplier now delivers nine days later than last quarter.
From the report Know which suppliers keep their word
Transport cost per delivery rose in one region after a carrier change.
From the report Follow what transport really costs you
One carrier accounts for most of the recent late deliveries.
From the report Track what arrives on time, and what does not
Example findings. Real ones come from your own data, in the report that produces them.
A finding with no follow-up is worth nothing
Six things Data360 does once a figure matters.
- AlertSet a line on a figure that matters and see when it is crossed.
- Tell peopleTell you, chosen teammates, or everyone who can open the app.
- Refresh reportsRead the figures again so every report is current.
- Re-check qualityMeasure the tables again and flag what broke.
- Clean and saveRemove duplicates, filter, combine and total, then save the result as a table.
- ExportTake the rows behind a figure away as a spreadsheet file, or save them as a table.
See Supply Chain 360 on your own data.
Your goals, your data — and the reports built from them.